Read the signals, not the headlines
Will Austin’s Housing Market Crash? Reading the September 2026 Data
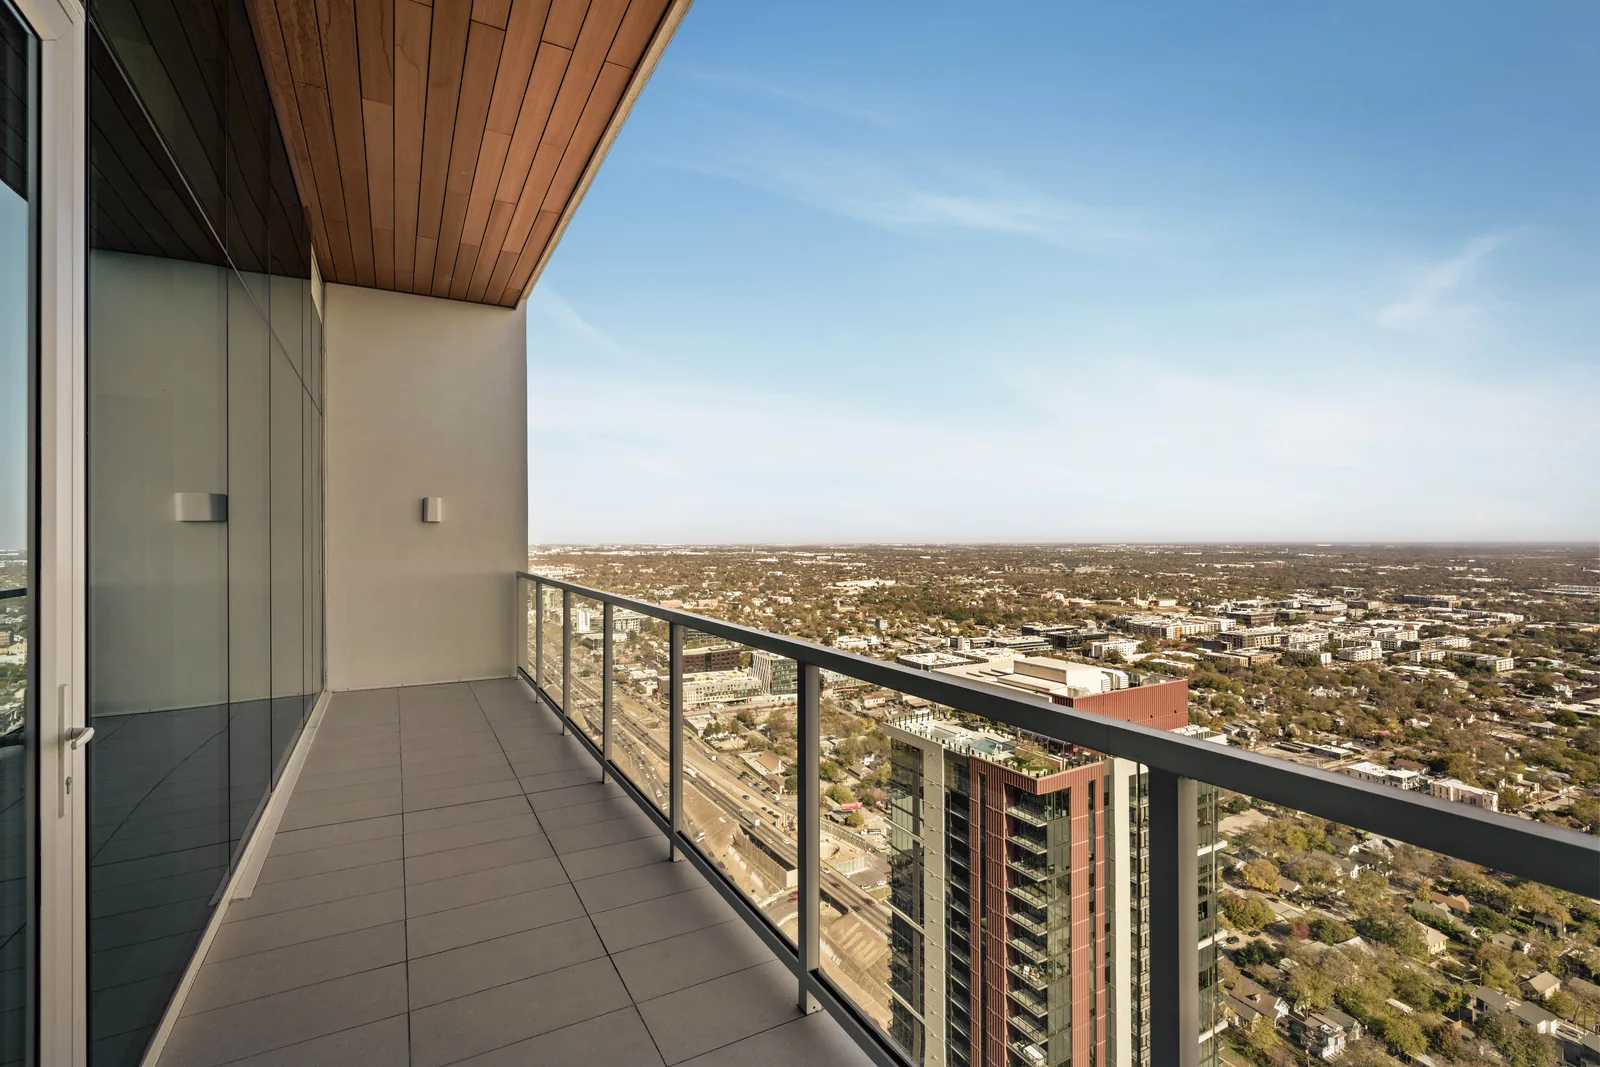
The September 2026 Austin-area housing report does not provide a reliable yes-or-no prediction of a future crash. It shows a market with fewer closed sales than a year earlier, a modestly higher metro median sale price, and substantial inventory. Those measures describe different parts of the market; none should be treated as a stand-alone forecast.
This analysis uses Unlock MLS figures for September 2026, published October 13, 2026, and checked October 29. “Austin” can mean the city or the wider metro, so the geography is stated with each comparison.
What the September metro report says
For the Austin-Round Rock-San Marcos metro, Unlock MLS reported 2,223 closed sales, down 14.8% year over year. The median sale price was $421,000, up 1.4%. Active listings totaled 13,465, down 3.4%, with 5.4 months of inventory, down 0.1 month. The report’s sales graphic showed 73 average days on market, three fewer than a year earlier.
Taken together, lower transaction volume and a slightly higher median price do not describe the same thing as a uniform price decline. They also do not mean every seller has gained leverage. Read the September market report as a set of measures rather than reducing it to one dramatic label.
City figures are a different comparison
For the City of Austin, the same report recorded 777 closed sales, down 12.7% year over year, and a $570,958 median sale price, up 4.2%. City inventory was 5.4 months. Do not compare the city median with the metro median as though they measure an identical group of properties.
A median is the middle price among the sales in the reported set. It can change when the mix of homes sold changes. It does not mean that each individual property rose or fell by the headline percentage, and it does not supply a valuation for a particular address.
What to examine before drawing a conclusion
Start with the period and comparison. A monthly change, a year-over-year change, and a comparison with a past peak answer different questions. Next, check the geography and property segment. A condominium, a central-city house, and a larger tract outside the city may face different competing inventory.
Then look for agreement across several measures over time. Sales volume describes completed activity. Inventory and time on market help describe the options and pace facing participants. Prices require their own context. If one measure moves while another does not, the discrepancy is a reason to investigate, not a reason to discard whichever figure conflicts with a headline.
What this means for preparing a listing
Use recent, relevant comparable properties and the home’s actual condition to discuss positioning with the listing professional. Separate a pricing decision from a photography decision: strong images can explain a home, but they do not establish its market value or guarantee a sale.
Marketing should make comparison easier. Show the approach, main rooms, outdoor spaces, and significant layout relationships accurately. If the listing has changed since it was photographed, update the imagery. Buyers should be able to connect the online presentation with what they encounter during a visit.
Keep the date attached to the evidence
Use Unlock MLS’s current statistics when a newer reporting period is available. Do not quietly reuse the numbers here under a new date. This article remains a September 2026 snapshot until the figures and interpretation are revised together.
For an example of how a past prediction differs from a later result, read our review of Zillow’s 2020 Austin forecast. Historical expectations can be informative, but they do not replace current local evidence.
Prepare an accurate listing presentation with our Austin real estate photography service.
In perspective
What matters most.
Look at inventory.
More listings can change how much choice buyers have.
Watch transaction time.
Days on market and reductions add context.
Narrow the comparison.
Neighborhood and property type matter more than a broad label.
Selected portfolio
Different properties face different conditions.



Explore photography
Present the property as it is.
Strong visual information helps buyers understand a listing in any market.